Retailer Increases Revenue By 12% with Synthefy's Multivariate Timeseries Foundation Model
A specialty retailer with $500M + annual revenue improved revenue by 12% by selecting pricing strategies using Synthefy's multivariate timeseries foundation model.

What's the Challenge?
Lack of accurate, multivariate forecasts
The retailer's baseline methods were insufficient to accurately predict monthly sales at each location. Without proper multivariate forecasting, they couldn't optimize SKU prices across their 100k+ locations effectively.
Lack of a good pricing simulator
Without an accurate multivariate model that understands the relationship between price and sales, simulating the future sales at a given price was difficult for our customer.
Limited data
Our customer had insufficient data for each location to train custom models. A foundation model that learns the similarities and differences between locations in context was absolutely necessary.
Synthefy's Solution
We provided a comprehensive AI-powered solution that transformed their forecasting and pricing capabilities:
- Built best-in-class demand forecasting using both historical and live data to continuously discover patterns
- Incorporated external event data to refine forecast precision
- Enabled accurate, auditable, and adjustable forecasts that update weekly
- Created a pricing simulator that predicts quantity sold at each potential price point
- Delivered 22% more accurate forecasts than state-of-the-art models
By predicting which price point results in the highest revenue, our customer was able to make data-driven pricing decisions with confidence.
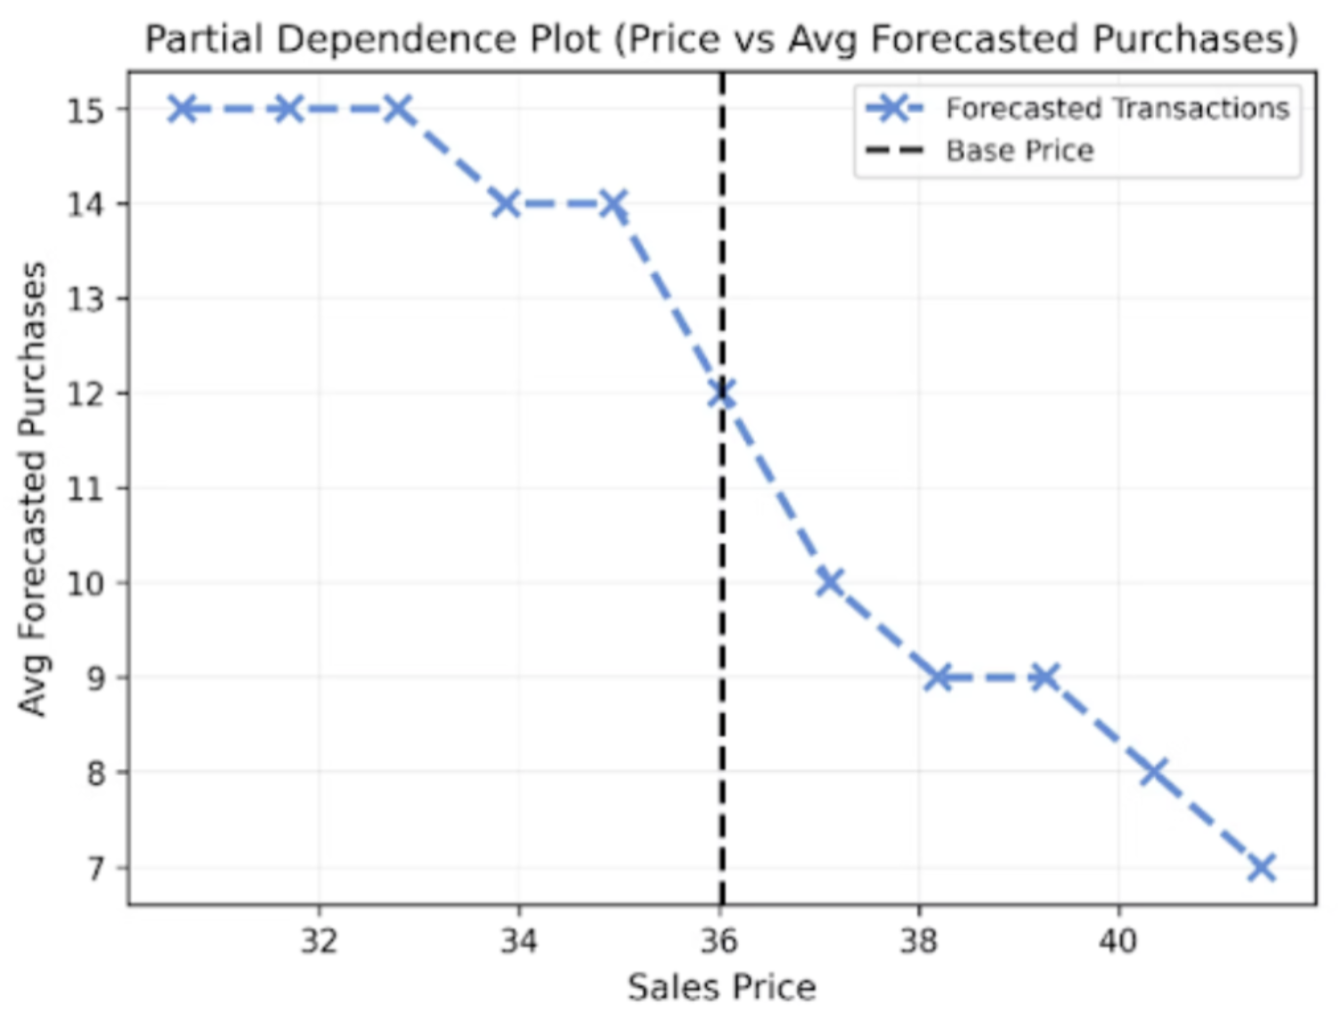
Figure 1a: Synthefy predicts the number of items sold at each price option. As the sales price increases, the average forecasted purchases decrease, allowing the retailer to understand the price-demand relationship.
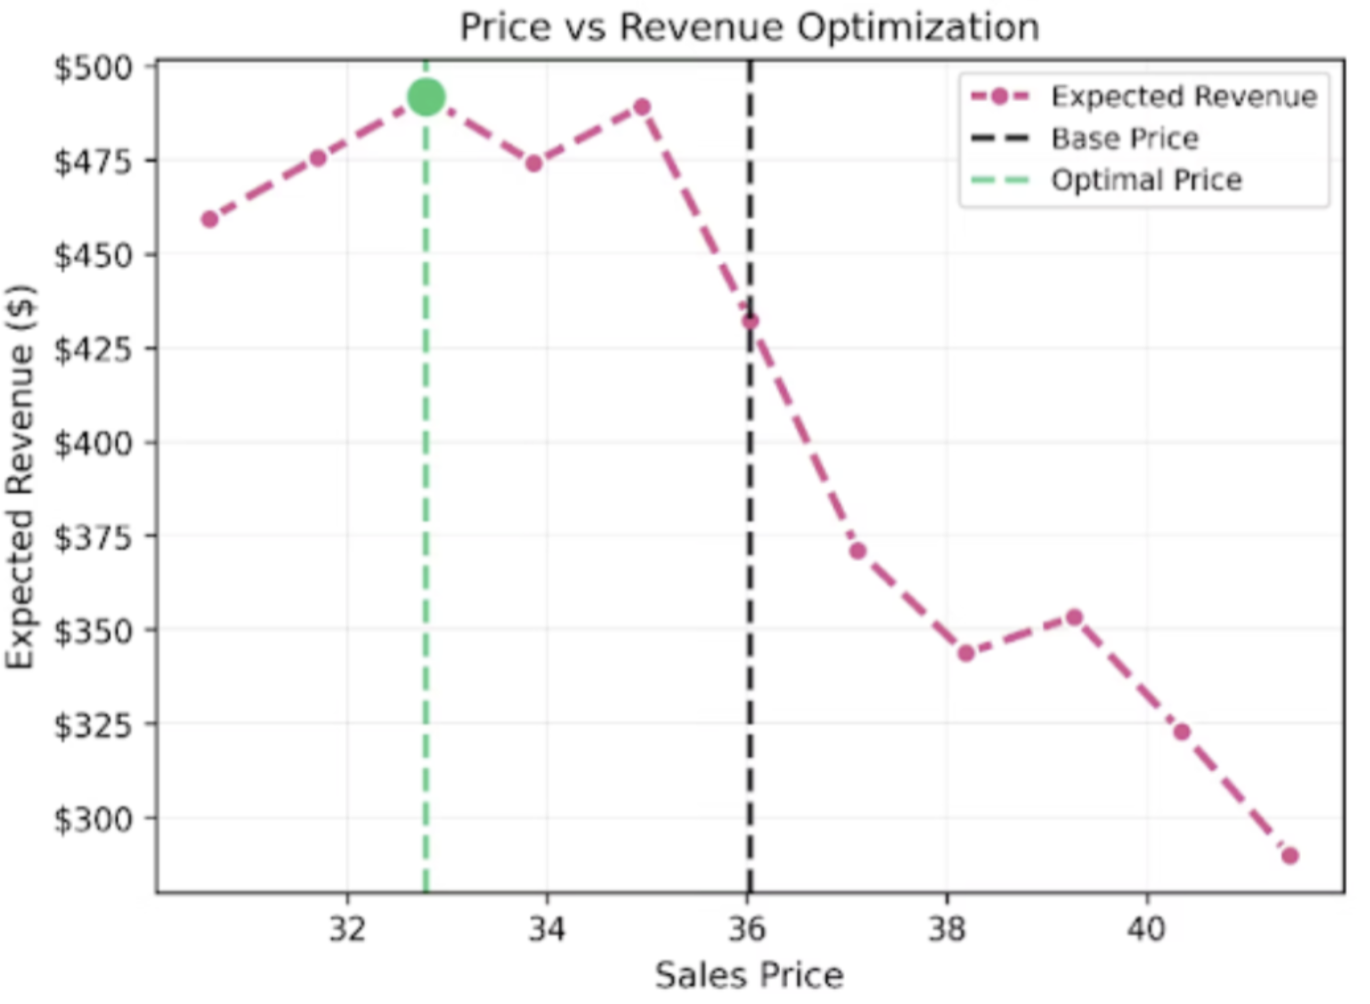
Figure 1b: Synthefy finds the sales price that maximizes expected revenue. The model identifies the optimal price point where expected revenue peaks, balancing price and demand.
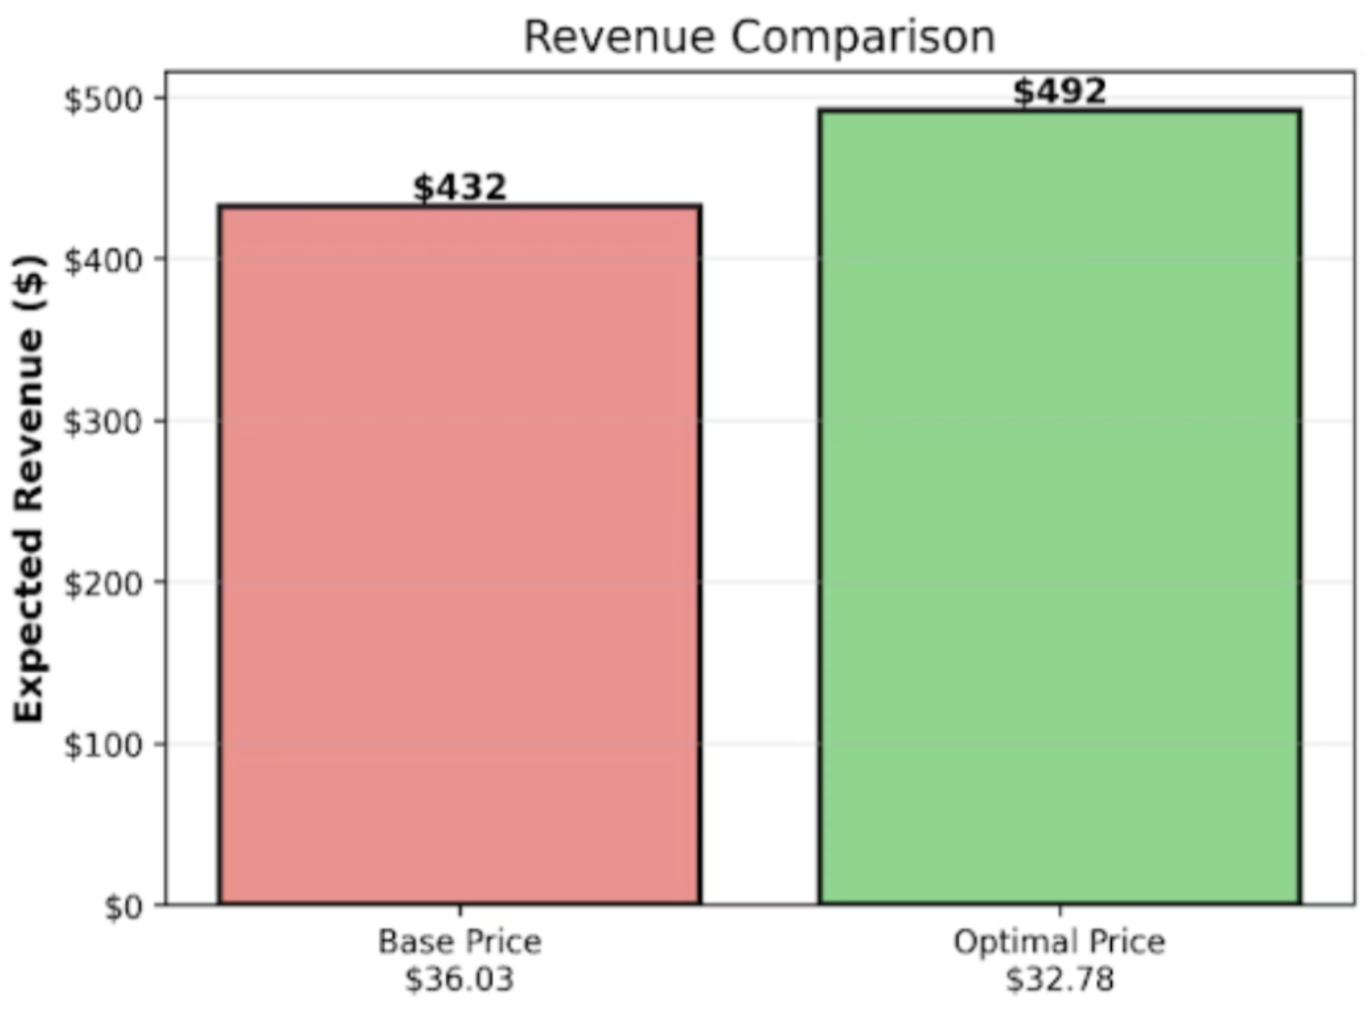
Figure 1c: Pricing at the predicted optimal price yields a 14% revenue increase for the specific store compared to the base price. This demonstrates the tangible impact of Synthefy's multivariate timeseries foundation model on revenue optimization.
Our Customer Didn't Gamble
We demonstrated state-of-the-art forecasting and pricing simulation performance in up to a year of backtesting data before implementing our solution in real-time, live data.
